Archive
View: 2004, Jan, Feb, Mar, Apr, May, Jun, Jul, Aug, Sep, Oct, Nov, Dec, 2006, By category, Full index
Viewing entries for February 2005
Voidwars ticker graph
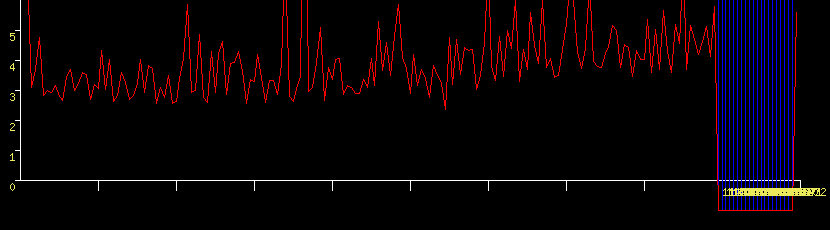
Blue vertical lines are bad.
For the curious, the graph shows the time to run each tick on Voidwars in seconds (y-axis) with the most recent tick being at the far right. Each blue vertical line is a tick that failed to complete.
P.S. if the above image appears too wide and sticks outside the edge of this post, you probably need to upgrade to a web browser that actually understands “max-width”.
Posted: 2005-02-02 01:42:44 UTC by Xiven | Cross-references (0) | Comments (3)